Plik:Newton iteration.png

Treść strony nie jest dostępna w innych językach.
Z Wikibooks, biblioteki wolnych podręczników.

Rozmiar pierwotny(2406 × 1978 pikseli, rozmiar pliku: 55 KB, typ MIME: image/png)

Ten plik znajduje się w Wikimedia Commons i może być używany w innych projektach. Poniżej znajdują się informacje ze strony opisu tego pliku.

Opis

Ta ilustracja ma także wersję wektorową („SVG”).
Zaleca się wykorzystywanie w galeriach dostępnej wersji wektorowej zamiast obecnej.

File:Newton iteration.png → File:Newton iteration.svg

Więcej o grafice wektorowej przeczytasz w artykule Przenoszenie grafik Commons do formatu SVG.
Dostępna jest także informacja o obsłudze grafik SVG przez MediaWiki.
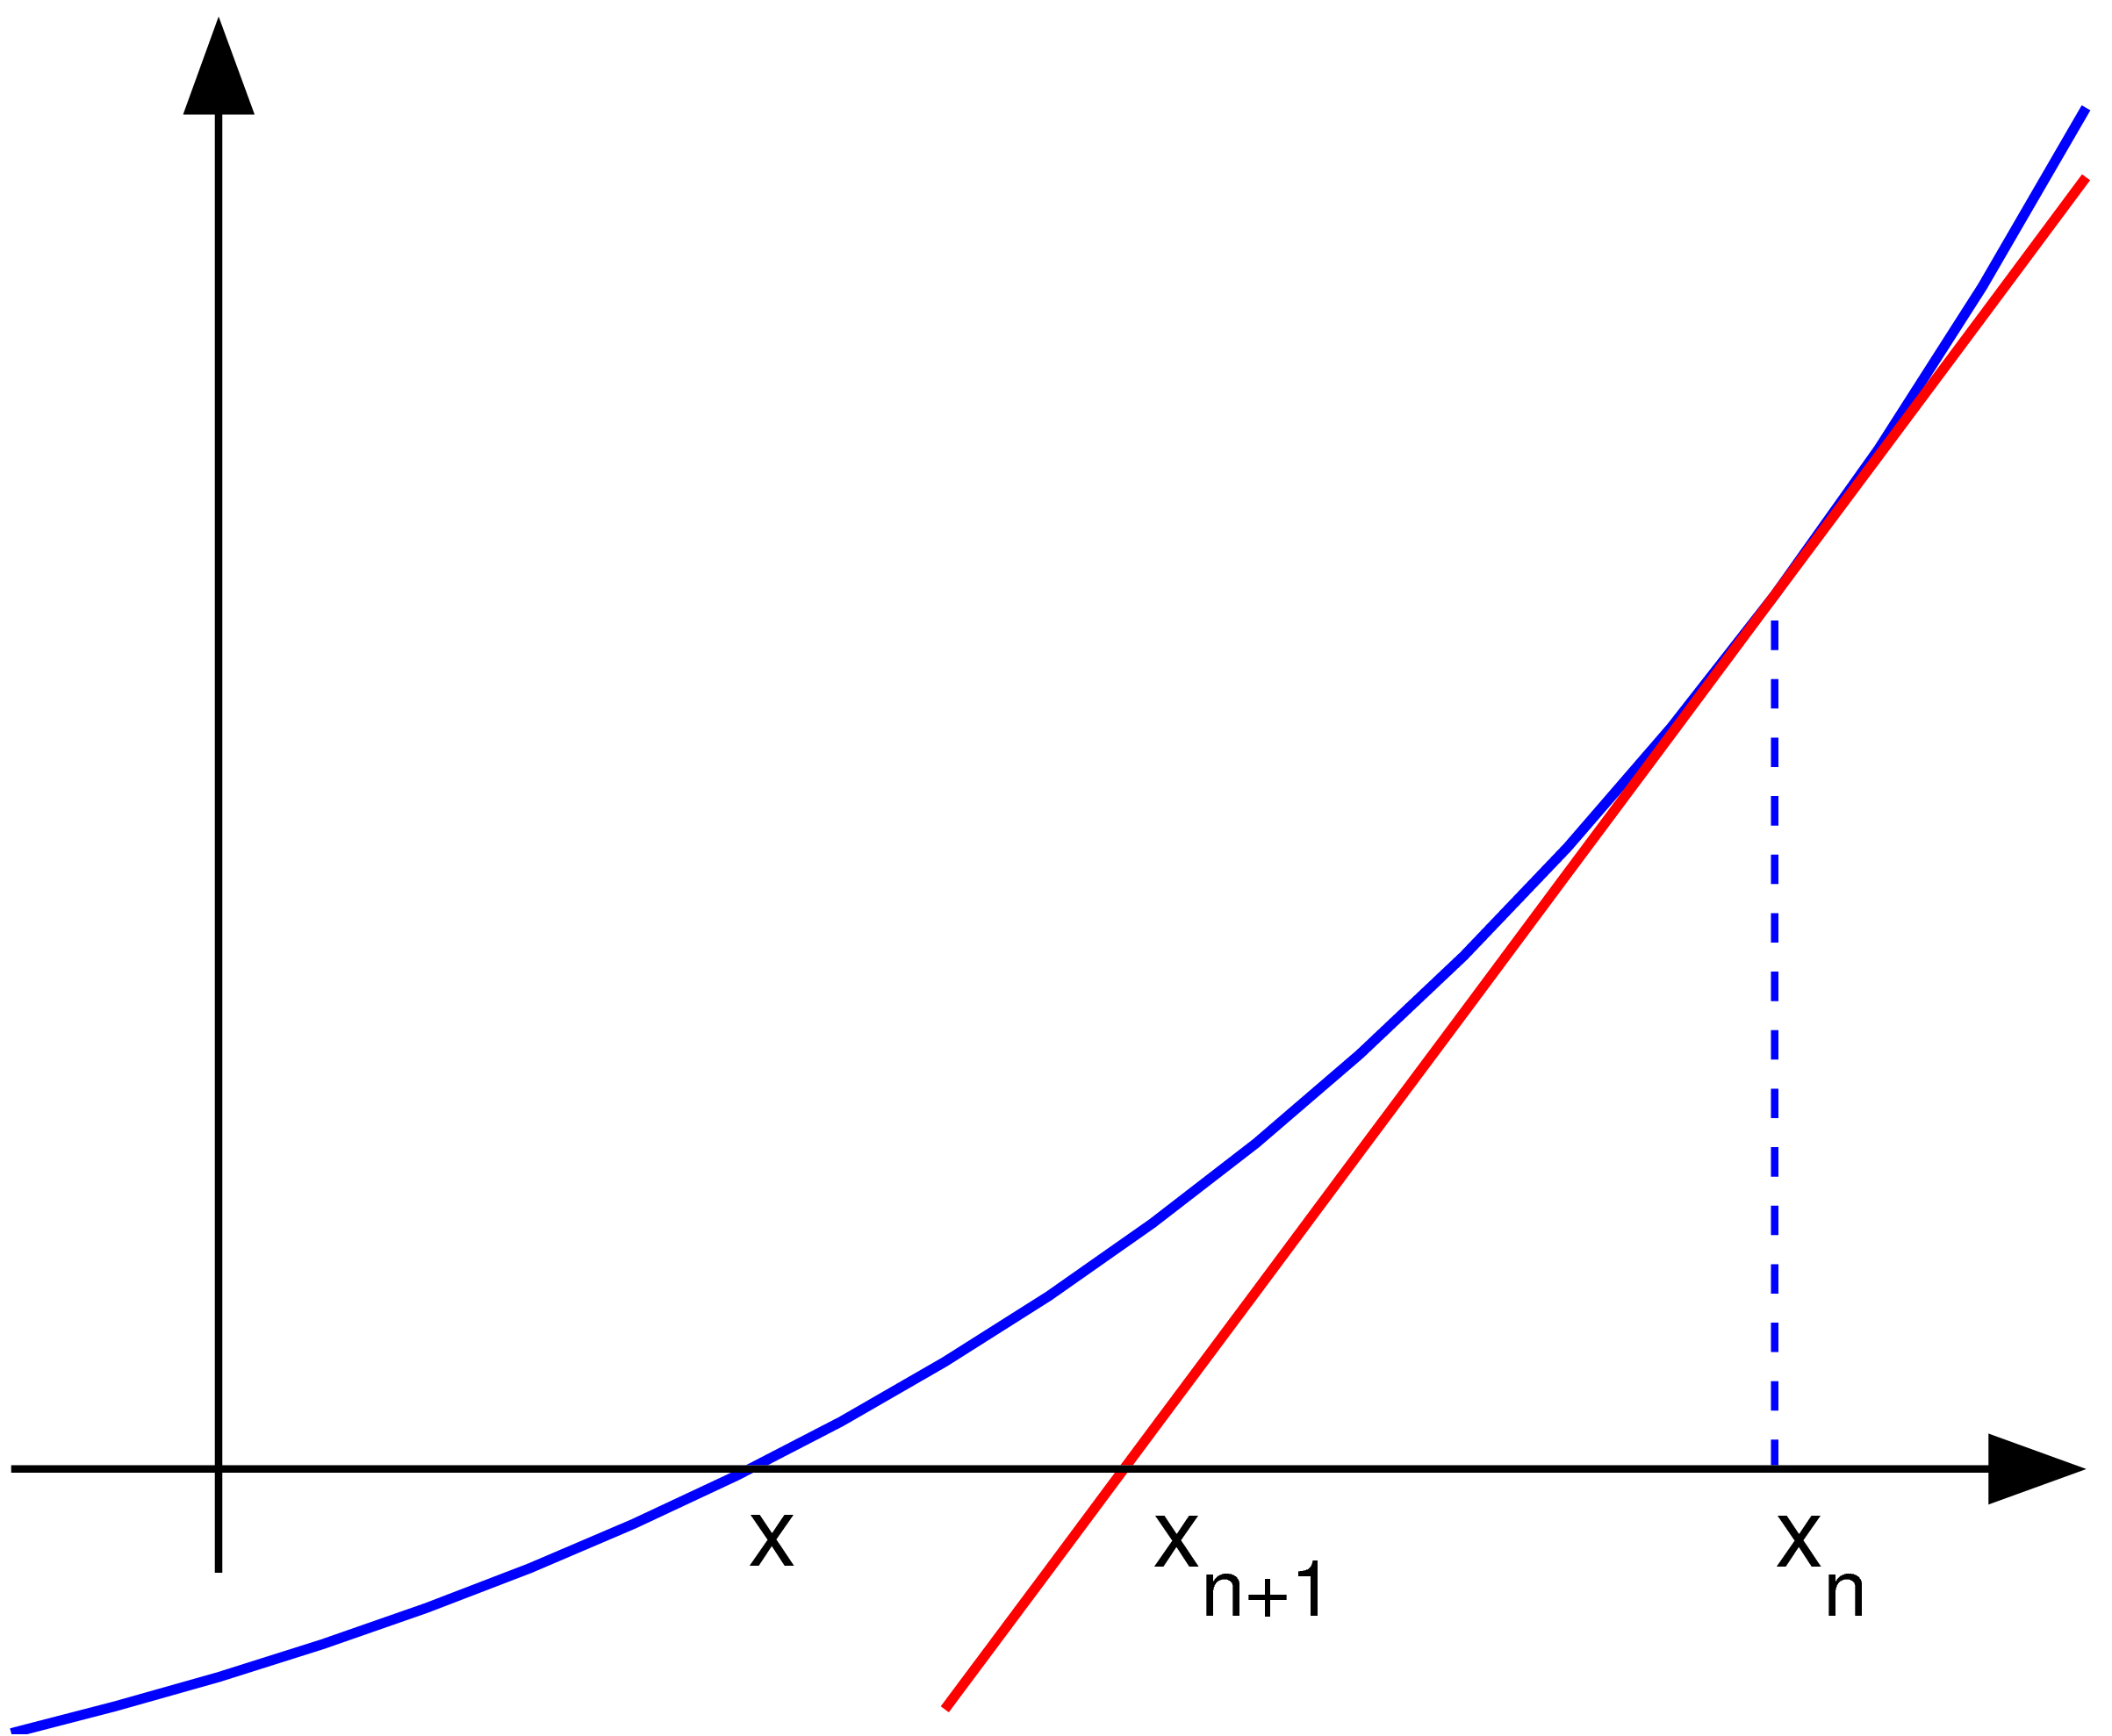
W innych językach
Alemannisch  Bahasa Indonesia  Bahasa Melayu  British English  català  čeština  dansk  Deutsch  eesti  English  español  Esperanto  euskara  français  Frysk  galego  hrvatski  Ido  italiano  lietuvių  magyar  Nederlands  norsk bokmål  norsk nynorsk  occitan  Plattdüütsch  polski  português  português do Brasil  română  Scots  sicilianu  slovenčina  slovenščina  suomi  svenska  Tiếng Việt  Türkçe  vèneto  Ελληνικά  беларуская (тарашкевіца)  български  македонски  нохчийн  русский  српски / srpski  татарча/tatarça  українська  ქართული  հայերեն  বাংলা  தமிழ்  മലയാളം  ไทย  한국어  日本語  简体中文  繁體中文  עברית  العربية  فارسی  +/−
Nowa grafika

Opis Uploader graphed this with en:MATLAB (Illustration of en:Newton's method)
Data 22 listopada 2004 (first version); 2004-11-23 (last version)
Źródło Na Commons przeniesiono z en.wikipedia.
Autor Olegalexandrov z angielskiej Wikipedii
PNG rozwój
InfoField
 
Ten diagram został stworzony za pomocą MATLAB
Kod źródłowy
InfoField

MATLAB code

(Newton iteration)
% illustration of Newton's method for finding a zero of a function

function main ()
   
a=-1; b=1;   % interval endpoints
fs=20;       % text font size

% arrows settings
thickness1=2; thickness2=1.5; arrowsize=0.1; arrow_type=1;
angle=20; % in degrees

h=0.1;  % grid size
X=a:h:b; % points on the x axis
f=inline('exp(x)/1.5-0.5');   % function to plot
g=inline('exp(x)/1.5');       % derivative of f
x0=0.7; y0=f(x0);             % point at which to draw the tangent line 
m=g(x0);
Y=f(X);                       % points on the function to plot
XT=-0.1:h:b; YT=y0+(XT-x0)*m; % tangent line

% prepare the screen
clf; hold on; axis equal; axis off

% plot the graph and the tangent lines
plot(X, Y, 'linewidth', thickness1)
plot(XT, YT, 'r', 'linewidth', thickness1)
plot([x0 x0], [0, y0], '--', 'linewidth', thickness2)

% axes
small=0.2;
arrow([a 0], [b, 0], thickness2, arrowsize, angle, arrow_type, [0, 0, 0])
arrow([a+small, -0.1], [a+small, 1.4], thickness2, arrowsize, angle, arrow_type, [0, 0, 0])

% text
H=text(-0.29, -0.06,  'x'); set(H, 'fontsize', fs)
H=text(0.1, -0.1,  'x_{n+1}'); set(H, 'fontsize', fs)
H=text(0.7, -0.1,  'x_{n}'); set(H, 'fontsize', fs)

% save to disk
saveas(gcf, 'newton_iteration.eps', 'psc2')

function arrow(start, stop, thickness, arrow_size, sharpness, arrow_type, color)

% Function arguments:
% start, stop:  start and end coordinates of arrow, vectors of size 2
% thickness:    thickness of arrow stick
% arrow_size:   the size of the two sides of the angle in this picture ->
% sharpness:    angle between the arrow stick and arrow side, in degrees
% arrow_type:   1 for filled arrow, otherwise the arrow will be just two segments
% color:        arrow color, a vector of length three with values in [0, 1]

% convert to complex numbers
   i=sqrt(-1);
   start=start(1)+i*start(2); stop=stop(1)+i*stop(2);
   rotate_angle=exp(i*pi*sharpness/180);

% points making up the arrow tip (besides the "stop" point)
   point1 = stop - (arrow_size*rotate_angle)*(stop-start)/abs(stop-start);
   point2 = stop - (arrow_size/rotate_angle)*(stop-start)/abs(stop-start);

   if arrow_type==1 % filled arrow

      % plot the stick, but not till the end, looks bad
      t=0.5*arrow_size*cos(pi*sharpness/180)/abs(stop-start); stop1=t*start+(1-t)*stop;
      plot(real([start, stop1]), imag([start, stop1]), 'LineWidth', thickness, 'Color', color);

      % fill the arrow
      H=fill(real([stop, point1, point2]), imag([stop, point1, point2]), color);
      set(H, 'EdgeColor', 'none')

   else % two-segment arrow
      plot(real([start, stop]), imag([start, stop]),   'LineWidth', thickness, 'Color', color);
      plot(real([stop, point1]), imag([stop, point1]), 'LineWidth', thickness, 'Color', color);
      plot(real([stop, point2]), imag([stop, point2]), 'LineWidth', thickness, 'Color', color);
   end

Licencja

Public domain Ten utwór został udostępniony jako własność publiczna przez jego autora, Olegalexandrov z angielskiej Wikipedii. Dotyczy to całego świata.
W niektórych krajach może nie być to prawnie możliwe, jeśli tak, to:
Olegalexandrov zapewnia każdemu prawo do użycia tej pracy w dowolnym celu, bez żadnych ograniczeń, chyba że te ograniczenia są wymagane przez prawo.


Oryginalny rejestr przesyłania

Oryginalna strona opisu była tutaj. Wszystkie poniższe nazwy użytkowników odwołują się do en.wikipedia.
  • 2004-11-23 19:55 Olegalexandrov 405×340×8 (14290 bytes) Scaled down the picture of Newton's method
  • 2004-11-22 21:34 Olegalexandrov 509×406×8 (16510 bytes) I graphed this with Matlab (Illustration of Newton's method) {{PD}}

Podpisy

Dodaj jednolinijkowe objaśnienie tego, co ten plik pokazuje

Obiekty przedstawione na tym zdjęciu

przedstawia

Historia pliku

Kliknij na datę/czas, aby zobaczyć, jak plik wyglądał w tym czasie.

Data i czasMiniaturaWymiaryUżytkownikOpis
aktualny05:23, 25 maj 2007Miniatura wersji z 05:23, 25 maj 20072406 × 1978 (55 KB)Oleg Alexandrov{{Information |Description=Uploader graphed this with en:MATLAB (Illustration of en:Newton's method) ==Source code== <pre> <nowiki> % illustration of Newton's method for finding a zero of a function function main () a=-1; b=1; % interva
01:11, 13 cze 2005Miniatura wersji z 01:11, 13 cze 2005405 × 340 (6 KB)Everlongoptimized for smaller file size
01:06, 18 sty 2005Miniatura wersji z 01:06, 18 sty 2005405 × 340 (14 KB)Andreas Ipp~commonswiki{{PD}}: Original author graphed this with MATLAB (Illustration of Newton's method), from Wikipedia.

Żadna strona nie korzysta z tego pliku.

Globalne wykorzystanie pliku

Ten plik jest wykorzystywany także w innych projektach wiki: