
Gnuplot/palette
Palette czyli gradient koloru[1]
Wstęp
[edytuj]Gradient koloru może być:
- ciągły / nieciągły ( dyskretny),
- szary/kolorowy.
Color mapping
[edytuj]Gradient ciągły korzysta z mapowania koloru (ang. color mapping), które może być:
- ciągle korzysta z analitycznych formuł (wzorów). Zobacz polecenia rgbformulae i functions,
- nieciągle (dyskretne) korzysta z tabel do interpolacji. Zobacz polecenia palette defined i palette file.
Show
[edytuj]Sprawdzamy jaki mamy standardowy gradient kolorów (tradycyjny pm3d – czarny-niebieski-czerwony-żółty):
show palette
Otrzymujemy:
palette is COLOR
rgb color mapping by rgbformulae are 7,5,15
figure is POSITIVE
all color formulae ARE NOT written into output postscript file
allocating ALL remaining color positions for discrete palette terminals
Color-Model: RGB
gamma is 1.5
Test
[edytuj]Wykres składowych koloru otrzymamy:
test palette[2]

Możemy to zapisać do pliku png:
set terminal png
set output 'p.png'
test palette
gdzie :
- NTSC

//from function test_palette_subcommand from command.c
ntsc = 0.299 * rgb.r + 0.587 * rgb.g + 0.114 * rgb.b;
Kod :
// command.c
/*
 * process the 'test palette' command
 * 1) Write a sequence of plot commands + set commands into a temp file
 * 2) Create a datablock with palette values
 * 3) Load the temp file to plot from the datablock
 *    The set commands then act to restore the initial state
 */
static void
test_palette_subcommand()
{
    enum {test_palette_colors = 256};
    struct udvt_entry *datablock;
    char *save_replot_line;
    TBOOLEAN save_is_3d_plot;
    int i;

    static const char pre1[] = "\
reset;\
uns border; se tics scale 0;\
se cbtic 0,0.1,1 mirr format '' scale 1;\
se xr[0:1];se yr[0:1];se zr[0:1];se cbr[0:1];\
set colorbox hor user orig 0.05,0.02 size 0.925,0.12;";

    static const char pre2[] = "\
se lmarg scre 0.05;se rmarg scre 0.975; se bmarg scre 0.22; se tmarg scre 0.86;\
se grid; se xtics 0,0.1;se ytics 0,0.1;\
se key top right at scre 0.975,0.975 horizontal \
title 'R,G,B profiles of the current color palette';";

    static const char pre3[] = "\
p NaN lc palette notit,\
$PALETTE u 1:2 t 'red' w l lt 1 lc rgb 'red',\
'' u 1:3 t 'green' w l lt 1 lc rgb 'green',\
'' u 1:4 t 'blue' w l lt 1 lc rgb 'blue',\
'' u 1:5 t 'NTSC' w l lt 1 lc rgb 'black'\
\n";

    FILE *f = tmpfile();

#if defined(_MSC_VER) || defined(__MINGW32__)
    /* On Vista/Windows 7 tmpfile() fails. */
    if (!f) {
	char buf[PATH_MAX];
	/* We really want the "ANSI" version */
	GetTempPathA(sizeof(buf), buf);
	strcat(buf, "gnuplot-pal.tmp");
	f = fopen(buf, "w+");
    }
#endif

    while (!END_OF_COMMAND)
	c_token++;
    if (!f)
	int_error(NO_CARET, "cannot write temporary file");

    /* Store R/G/B/Int curves in a datablock */
    datablock = add_udv_by_name("$PALETTE");
    if (datablock->udv_value.type != NOTDEFINED)
	gpfree_datablock(&datablock->udv_value);
    datablock->udv_value.type = DATABLOCK;
    datablock->udv_value.v.data_array = NULL;

    /* Part of the purpose for writing these values into a datablock */
    /* is so that the user can read them back if desired.  But data  */
    /* will be read back using the current numeric locale, so for    */
    /* consistency we must also use the locale when creating it.     */
    set_numeric_locale();
    for (i = 0; i < test_palette_colors; i++) {
	char dataline[64];
	rgb_color rgb;
	double ntsc;
	double z = (double)i / (test_palette_colors - 1);
	double gray = (sm_palette.positive == SMPAL_NEGATIVE) ? 1. - z : z;
	rgb1_from_gray(gray, &rgb);
	ntsc = 0.299 * rgb.r + 0.587 * rgb.g + 0.114 * rgb.b;
	sprintf(dataline, "%0.4f %0.4f %0.4f %0.4f %0.4f %c",
		z, rgb.r, rgb.g, rgb.b, ntsc, '\0');
	append_to_datablock(&datablock->udv_value, strdup(dataline));
    }
    reset_numeric_locale();

    /* commands to setup the test palette plot */
    enable_reset_palette = 0;
    save_replot_line = gp_strdup(replot_line);
    save_is_3d_plot = is_3d_plot;
    fputs(pre1, f);
    fputs(pre2, f);
    fputs(pre3, f);

    /* save current gnuplot 'set' status because of the tricky sets
     * for our temporary testing plot.
     */
    save_set(f);

    /* execute all commands from the temporary file */
    rewind(f);
    load_file(f, NULL, 1); /* note: it does fclose(f) */

    /* enable reset_palette() and restore replot line */
    enable_reset_palette = 1;
    free(replot_line);
    replot_line = save_replot_line;
    is_3d_plot = save_is_3d_plot;
}
Set
[edytuj]Polecenie
set palette
przywraca standardowe ustawienia:
// color.c
void
init_color()
{
  /* initialize global palette */
  sm_palette.colorFormulae = 37;  /* const */
  sm_palette.formulaR = 7;
  sm_palette.formulaG = 5;
  sm_palette.formulaB = 15;
  sm_palette.positive = SMPAL_POSITIVE;
  sm_palette.use_maxcolors = 0;
  sm_palette.colors = 0;
  sm_palette.color = NULL;
  sm_palette.ps_allcF = FALSE;
  sm_palette.gradient_num = 0;
  sm_palette.gradient = NULL;
  sm_palette.cmodel = C_MODEL_RGB;
  sm_palette.Afunc.at = sm_palette.Bfunc.at = sm_palette.Cfunc.at = NULL;
  sm_palette.colorMode = SMPAL_COLOR_MODE_RGB;
  sm_palette.gamma = 1.5;
}
Color/gray
[edytuj]Składnia :
set palette {gray | color }
Ustawia ciągły gradient koloru lub skali szarości. Gradient dyskretny (= nie ciągły) ustawia polecenie set palette maxcolors.
Ustawienie szarej palety kolorów:
set palette gray
przy standardowych ustawieniach odpowiada to:
set palette gray positive gamma 1.5 # nieliniowa
Jeśli chcemy otrzymać liniową paletę to ustawiamy gamma na 1.0:
set palette gray gamma 1.0 # liniowa paleta
Powrót do kolorowej palety:
set palette color
Zobacz też color modes:
//color.h
/*
 *    color modes
 */
typedef enum {
    SMPAL_COLOR_MODE_NONE = '0',
    SMPAL_COLOR_MODE_GRAY = 'g',      /* grayscale only */
    SMPAL_COLOR_MODE_RGB = 'r',       /* one of several fixed transforms */
    SMPAL_COLOR_MODE_FUNCTIONS = 'f', /* user defined transforms */
    SMPAL_COLOR_MODE_GRADIENT = 'd',  /* interpolated table:
				       * explicitly defined or read from file */
    SMPAL_COLOR_MODE_CUBEHELIX = 'c'
} palette_color_mode;
File
[edytuj]Składnia:
set palette file '<filename>' {datafile-modifiers}
gdzie:
- filename jest to nazwa pliku palety zawierającego kolumny z danymi. Nie jest to plik z rozszerzeniem pal zawierający polecenia gnuplota,
- data-modifiers jest to opcjonalny składnik służacy do wybierania elementów z palety( tabeli). Przykład: 'using ($1/255):($2/255):($3/255)'.
Polecenie `set palette file` odpowiada poleceniu set palette defined, a dane są wczytywane z pliku filename.
Sprawdzamy zawartość pomocy:
help set palette file
Przypadki użycia:
- plik tekstowy (gpf nie pal, który wczytujemy za pomocą polecenia load),
- plik binarny,
- dane wczytywane z linii poleceń.
Plik tekstowy
[edytuj]Składnia:
set palette file 'palette.txt' using ($1/255):($2/255):($3/255) # Read in a palette of RGB triples each in range [0,255]
W pliku mogą być:
- 4 kolumny: gray, R, G, B,
- trzy kolumny: R, G, B.
# http://soliton.vm.bytemark.co.uk/pub/cpt-city/arendal/arctic.gpf
set palette file "arctic.gpf"
set terminal png
set output "arctic.png"
test palette
Zbiory plików tekstowych:
- cpt-city : "Gnuplot Palette File (with gpf extension) in the RGB colour-space" ( 4 kolumny),
- Color Map for Scientific Visualization by Kenneth Moreland. Pobierany tabelę (float), zapisujemy jako plik tekstowy, zamieniamy przecinki na spacje i usuwamy lub komentujemy nagłówek tekstowy,
- pliki map programu Fractint (3 kolumny),
set palette file "Skydye07.map" using ($1/255):($2/255):($3/255) # Read in a palette of RGB triples each in range [0,255]
Plik binarny
[edytuj]Składnia:
set palette file "palette.bin" binary record=64 using 1:2:3 # put 64 triplets of R,G,B doubles into file palette.bin and load
Linia komend
[edytuj]Możemy użyć tego polecenia do wprowadzenie tabeli kolorów w linii komend:
- zamiast nazwy pliku podajemy nazwę specjalną (ang. special-filename): "-"[6],
- wprowadzamy tabelę,
- kończymy literą e.
# Equidistant rainbow (blue-green-yellow-red) palette
     set palette model RGB file "-"
     0 0 1
     0 1 0
     1 1 0
     1 0 0
     e
# cpt-city/ma/gray/grayscale01a 0 … 100, continuous, RGB, 3 segments
set palette file "-"
0.00000 0.00000 0.00000 0.00000
0.35010 0.93333 0.93333 0.93333
0.75000 0.80000 0.80000 0.80000
1.00000 0.66667 0.66667 0.66667
e
Cubehelix
[edytuj]- Cubehelix gradient
-
 2D RGB profile
 -
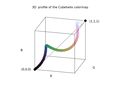 3D RGB profile


Rodzina palet kolorów opracowana przez D.A .Green (2011)[7], w której kolor (odcień) zmienia się wzdłuż standardowego koła kolorów, a jednocześnie intensywność rośnie monotonicznie, gdy wartość szarości zmienia się od 0 do 1.
Zalety:
- drukuje równie dobrze w kolorze i czerni/bieli[8].
W kodzie:
  // color.h: t_sm_palette typedef struct (Declaration of smooth palette, i.e. palette for smooth colours)
  /* control parameters for the cubehelix palette scheme */
  double cubehelix_start;	/* offset (radians) from colorwheel 0 */
  double cubehelix_cycles;	/* number of times round the colorwheel */
  double cubehelix_saturation;	/* color saturation */
The cubehelix palette can be modified by gamma. E.g.
set palette cubehelix gamma 2.0
Gamma
[edytuj]Składnia:
set palette gamma <gamma>
Ustawia współczynnik gamma na wartość <gamma>.
Standardowa wartość współczynnika gamma = 1.5.
Przykłady:[9]
set palette gamma 1.25
Gamma korekcja innymi metodami:[10]
  set palette model RGB
  set palette functions gray**0.64, gray**0.67, gray**0.70
lub:
gamma = 2.2
color(gray) = gray**(1./gamma)
set palette model RGB functions color(gray), color(gray), color(gray) # A gamma-corrected black and white palette
W stosunku do palet szarych zamiast
set palette defined ( 0 0 0 0, 1 1 1 1 )
możemy użyć:
set palette defined ( 0 0 0 0, 0.5 .73 .73 .73, 1 1 1 1 )
Zobacz w kodzie:
// color.h
/* gamma for gray scale and cubehelix palettes only */
  double gamma;
Model
[edytuj] set palette { model { RGB | HSV | CMY | XYZ }
Modele kolorów:
- RGB oznacza Red, Green, Blue
- CMY oznacza Cyan, Magenta, Yellow
- HSV oznacza Hue, Saturation, Value
Modeli YIQ i XYZ nie należy używać (zła lub niepełna implementacja).
Functions
[edytuj]Składnia:
set palette functions <R>,<G>,<B>
może być łączone:[11]
 set palette model HSV functions gray, 1, 1 # full color hsv = rainbow
 set palette model XYZ functions gray**0.35, gray**0.5, gray**0.8 # black to gold
gamma = 2.2
color(gray) = gray**(1./gamma)
set palette model RGB functions color(gray), color(gray), color(gray) # A gamma-corrected black and white palette
Definicje:
- gray jest zmienną przyjmującą wartości od 0 do 1.
Rgbformulae
[edytuj]Składnia:
set palette rgbformulae <r>,<g>,<b>
skrócona postać:
set palette rgb r,g,b
r, g i b są to funkcje odpowiadające za obliczenie każdej ze składowej koloru (mimo że nazwy składowych są R, G oraz B to ich znaczenie jest zależne od modelu koloru, tzn. w modelu HSV R będzie oznaczało H). Mamy do dyspozycji 37 wbudowanych funkcji ponumerowanych od 0 do 36 (liczby ujemne dają odwrócony gradient). Możemy je wyświetlić:
show palette rgbformulae
Otrzymamy:
* there are 37 available rgb color mapping formulae:
0: 0               1: 0.5             2: 1
3: x               4: x^2             5: x^3
6: x^4             7: sqrt(x)         8: sqrt(sqrt(x))
9: sin(90x)       10: cos(90x)       11: |x-0.5|
12: (2x-1)^2       13: sin(180x)      14: |cos(180x)|
15: sin(360x)      16: cos(360x)      17: |sin(360x)|
18: |cos(360x)|    19: |sin(720x)|    20: |cos(720x)|
21: 3x             22: 3x-1           23: 3x-2
24: |3x-1|         25: |3x-2|         26: (3x-1)/2
27: (3x-2)/2       28: |(3x-1)/2|     29: |(3x-2)/2|
30: x/0.32-0.78125 31: 2*x-0.84       32: 4x;1;-2x+1.84;x/0.08-11.5
33: |2*x - 0.5|    34: 2*x            35: 2*x - 0.5
36: 2*x - 1
* negative numbers mean inverted=negative colour component
* thus the ranges in `set pm3d rgbformulae' are -36..36
Kod znajdziemy w: gnuplot/src/getcolor.c/GetColorValueFromFormula
/*
 *  Original fixed color transformations
 */
double
GetColorValueFromFormula(int formula, double x)
{
    /* the input gray x is supposed to be in interval [0,1] */
    if (formula < 0) {		/* negate the value for negative formula */
	x = 1 - x;
	formula = -formula;
    }
    switch (formula) {
    case 0:  return 0;
    case 1:  return 0.5;
    case 2:  return 1;
    case 3:  /* x = x */ break;
    case 4:  x = x * x; 	break;
    case 5:  x = x * x * x; break;
    case 6:  x = x * x * x * x; 	break;
    case 7:  x = sqrt(x); break;
    case 8:  x = sqrt(sqrt(x)); 	break;
    case 9:  x = sin(90 * x * DEG2RAD); 	break;
    case 10: x = cos(90 * x * DEG2RAD); 	break;
    case 11: x = fabs(x - 0.5);  break;
    case 12: x = (2 * x - 1) * (2.0 * x - 1); 	break;
    case 13: x = sin(180 * x * DEG2RAD); 	break;
    case 14: x = fabs(cos(180 * x * DEG2RAD)); 	break;
    case 15: x = sin(360 * x * DEG2RAD); break;
    case 16: x = cos(360 * x * DEG2RAD); break;
    case 17: x = fabs(sin(360 * x * DEG2RAD)); 	break;
    case 18: x = fabs(cos(360 * x * DEG2RAD)); break;
    case 19: x = fabs(sin(720 * x * DEG2RAD)); break;
    case 20: x = fabs(cos(720 * x * DEG2RAD)); break;
    case 21: x = 3 * x;  break;
    case 22: x = 3 * x - 1; break;
    case 23: x = 3 * x - 2; break;
    case 24: x = fabs(3 * x - 1); break;
    case 25: x = fabs(3 * x - 2); break;
    case 26: x = (1.5 * x - 0.5); break;
    case 27: x = (1.5 * x - 1); break;
    case 28: x = fabs(1.5 * x - 0.5); break;
    case 29: x = fabs(1.5 * x - 1); break;
    case 30: if (x <= 0.25) return 0; if (x >= 0.57) return 1; 	x = x / 0.32 - 0.78125; break;
    case 31: if (x <= 0.42) return 0; if (x >= 0.92) return 1; x = 2 * x - 0.84; break;
    case 32: if (x <= 0.42) x *= 4; else x = (x <= 0.92) ? -2 * x + 1.84 : x / 0.08 - 11.5; break;
    case 33: x = fabs(2 * x - 0.5); break;
    case 34: x = 2 * x;  break;
    case 35: x = 2 * x - 0.5; 	break;
    case 36: x = 2 * x - 1; break;
	/*
	   IMPORTANT: if any new formula is added here, then:
	   (1) its postscript counterpart must be added to the array
	   ps_math_color_formulae[] below.
	   (2) number of colours must be incremented in color.c: variable
	   sm_palette, first item---search for "t_sm_palette sm_palette = "
	 */
    default: /* Cannot happen! */  	FPRINTF((stderr, "gnuplot:  invalid palette rgbformula"));
	x = 0;
    }
    if (x <= 0) return 0;
    if (x >= 1) return 1;
    return x;
}


Standardowo są wybrane funkcje nr 7 dla składowej czerwonej, 5 dla składowej zielonej i 15 dla niebieskiej. Możemy wybrać inny zestaw, na przykład proponowany w dokumentacji zestaw „gorący” (ang. hot = black-red-yellow-white):
set palette rgbformulae 21,22,23
albo odwrócony gorący gradient:
set palette rgbformulae -21,-22,-23
lub odwrócony liniowy gradient szarości
set palette rgbformulae -3,-3,-3 # 1-x, 1-x, 1-x
Przykłady przestrzenie RGB:[12]
       7,5,15   ... traditional pm3d (black-blue-red-yellow)
       3,11,6   ... green-red-violet
       23,28,3  ... ocean (green-blue-white); try also all other permutations
       30,31,32 ... color printable on gray (black-blue-violet-yellow-white)
       33,13,10 ... rainbow (blue-green-yellow-red)
       34,35,36 ... AFM hot (black-red-yellow-white)
Pełna paleta HSV
3,2,2 ... red-yellow-green-cyan-blue-magenta-red
Maxcolors
[edytuj]Polecenie:
set palette maxcolors <N>
z rozsądnie małą wartością N ustawia dyskretny gradient koloru. Ta opcja powoduje wybranie N dyskretnych kolorów z ciągłej palety, pobierane w równych odstępach czasu. Jeśli chcesz nierównych odstępów N dyskretne kolory, użyj:
set palette defined
Defined
[edytuj]Składnia:
set palette defined { ( <gray1> <color1> {, <grayN> <colorN>}... ) }
gdzie:
<color> := { <r> <g> <b> | ’<color-name>’ | ’#rrggbb’ }
Paleta jest zbudowana poprzez liniową interpolację między wartościami określonymi w definicji.
Przykłady:
 set palette defined (0 "dark-green", 1 "green", 1 "yellow", 4 "red")
 test palette
Otrzymujemy nieciągły gradient.
Za pomocą 2 kolorów otrzymujemy ciągły gradient (liniowy) pomiędzy bielą (1 1 1) a czernią (0 0 0 ).
   set palette model RGB
   set output "gray.png"
   set palette defined (0 1 1 1, 1 0 0 0) # <r> <g> <b>
   test palette
Inna równoważna składnie polecenia set palette:
   set palette defined ( 0 "white", 1 "black") # ’<color-name>’
   set palette defined ( 0 "#ffffff", 1 "#000000") # ’#rrggbb’
# Approximate the default palette used by MATLAB:
set pal defined (1 '#00008f', 8 '#0000ff', 24 '#00ffff', 40 '#ffff00', 56 '#ff0000', 64 '#800000')

Dane możemy wprowadzić z:
- linii poleceń,
- z pliku palety pal.
load 'a.pal'
Przykład pliku tekstowego pal:
# jet.pal with 4 columns
set palette defined (0  0.0 0.0 0.5, \
                     1  0.0 0.0 1.0, \
                     2  0.0 0.5 1.0, \
                     3  0.0 1.0 1.0, \
                     4  0.5 1.0 0.5, \
                     5  1.0 1.0 0.0, \
                     6  1.0 0.5 0.0, \
                     7  1.0 0.0 0.0, \
                     8  0.5 0.0 0.0 )
#  ColorBrewer Accent
# https://github.com/Gnuplotting/gnuplot-palettes/blob/master/accent.pal
# for use with qualitative/categorical data
# provides 8 colors, 4 pale and 4 saturated
# compatible with gnuplot >=4.2
# author: Anna Schneider
# pale green - pale purple - pale orange - pale yellow - blue - magenta - brown - grey
# palette
set palette maxcolors 8
set palette defined (
0 '#7FC97F',\
1 '#BEAED4',\
2 '#FDC086',\
3 '#FFFF99',\
4 '#386CB0',\
5 '#F0027F',\
6 '#BF5B17',\
7 '#666666' )
Zbiory palet:
Sprawdzamy jaki gradient ma aktualna paleta:
show palette gradient
Otrzymujemy:
 0. gray=0.0000, (r,g,b)=(1.0000,1.0000,1.0000), #ffffff = 255 255 255
 1. gray=1.0000, (r,g,b)=(0.0000,0.0000,0.0000), #000000 =   0   0   0
Inny przykład:
# http://www.gnuplotting.org/defining-a-palette-with-discrete-colors/
set palette maxcolors 3
set palette defined ( 0 '#000fff',\
                      1 '#90ff70',\
                      2 '#ee0000')
Nops_allcF | ps_allcF
[edytuj]Opcja dotyczy postscriptu[13].
Dla programistów
[edytuj]Sprawdzamy w jakich plikach użyto słowa palette:
grep -R --include *.c -l "palette"
src/command.c
src/color.c
src/unset.c
src/term.c
src/graph3d.c
src/plot2d.c
src/gadgets.c
src/plot3d.c
src/misc.c
src/set.c
src/graphics.c
src/breaders.c
src/boundary.c
src/save.c
src/tables.c
src/os2/gclient.c
src/datafile.c
src/plot.c
src/pm3d.c
src/gplt_x11.c
src/getcolor.c
src/show.c
term/sixel.c
a w jakich sm_palette:
grep -R --include *.c -l "sm_palette"
src/command.c
src/color.c
src/gadgets.c
src/set.c
src/save.c
src/plot.c
src/pm3d.c
src/gplt_x11.c
src/getcolor.c
src/show.c
Zobacz również
[edytuj]Źródła
[edytuj]- ↑ Gradient_(grafika) w Wikipedii
- ↑ /src/command.c
- ↑ Poynton's Color FAQ by Charles Poynton
- ↑ https://livebook gnuplot-in-action-second-edition by P K Janert
- ↑ Luma_(video) w ang wikipedii
- ↑ apimirror: gnuplot special-filenames
- ↑ A colour scheme for the display of astronomical intensity images by D. A. Green
- ↑ cubehelix-or-how-i-learned-to-love by James Davenport
- ↑ gnuplot 5.5 demo pm3dgamma
- ↑ gnuplot 5.0.4 : gamma
- ↑ gnuplot 4.2 docs: Palette/Functions
- ↑ gnuplot-doc : rgbformulae
- ↑ gnuplot docs_4.2